JOSEPH LICO
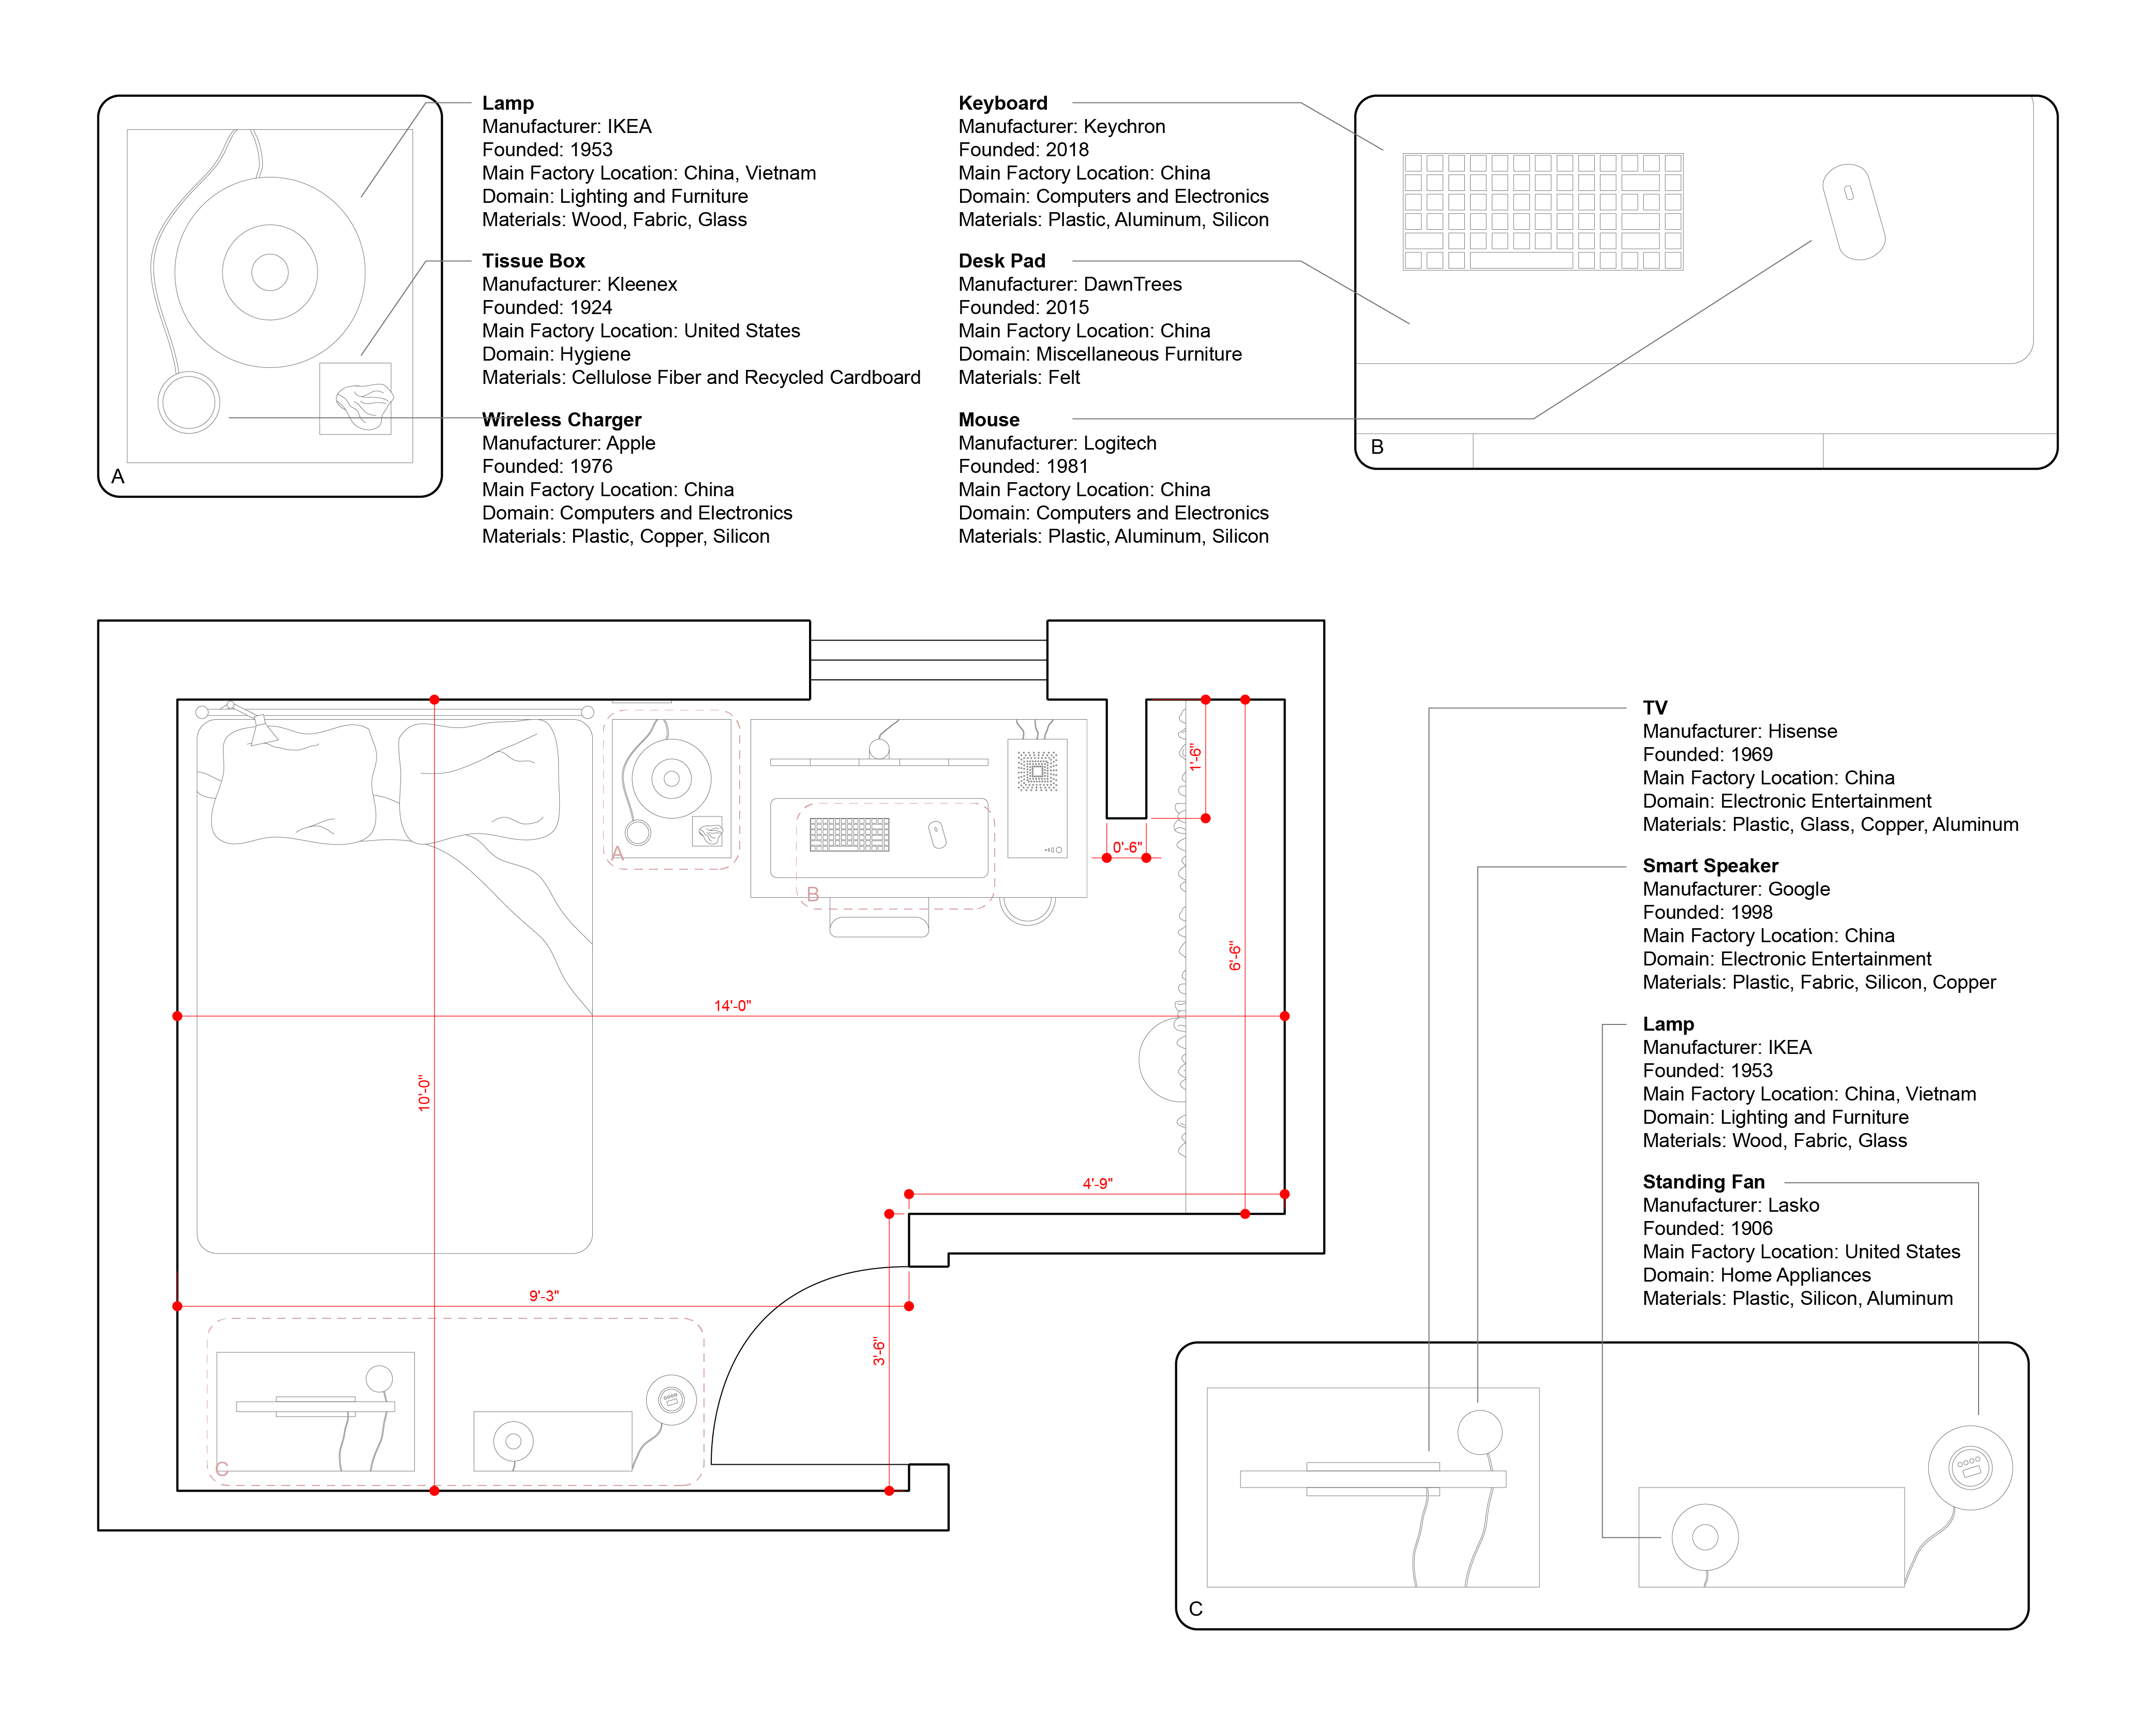
My room is one of two bedrooms in my apartment located on the second floor of the complex. Fixed at the southeast corner of the unit, a single southern-facing window lights the room. All objects within the space are bound to the perimeter - namely the north and south walls. The largest component being the queen bed (60"x80"), takes up a large percentage of the total floor surface. It sits beside a nightstand with a lamp (lamp), wireless charger (Apple), and tissue box (Kleenex). Continuing along the wall is my desk (49"x28") where I conduct the vast majority of my daily activities - school and work. Across from my bed is a dresser with a TV (Hisense) and a smart speaker (Google). Directly adjacent to that is a bookshelf and standing fan (Lasko).
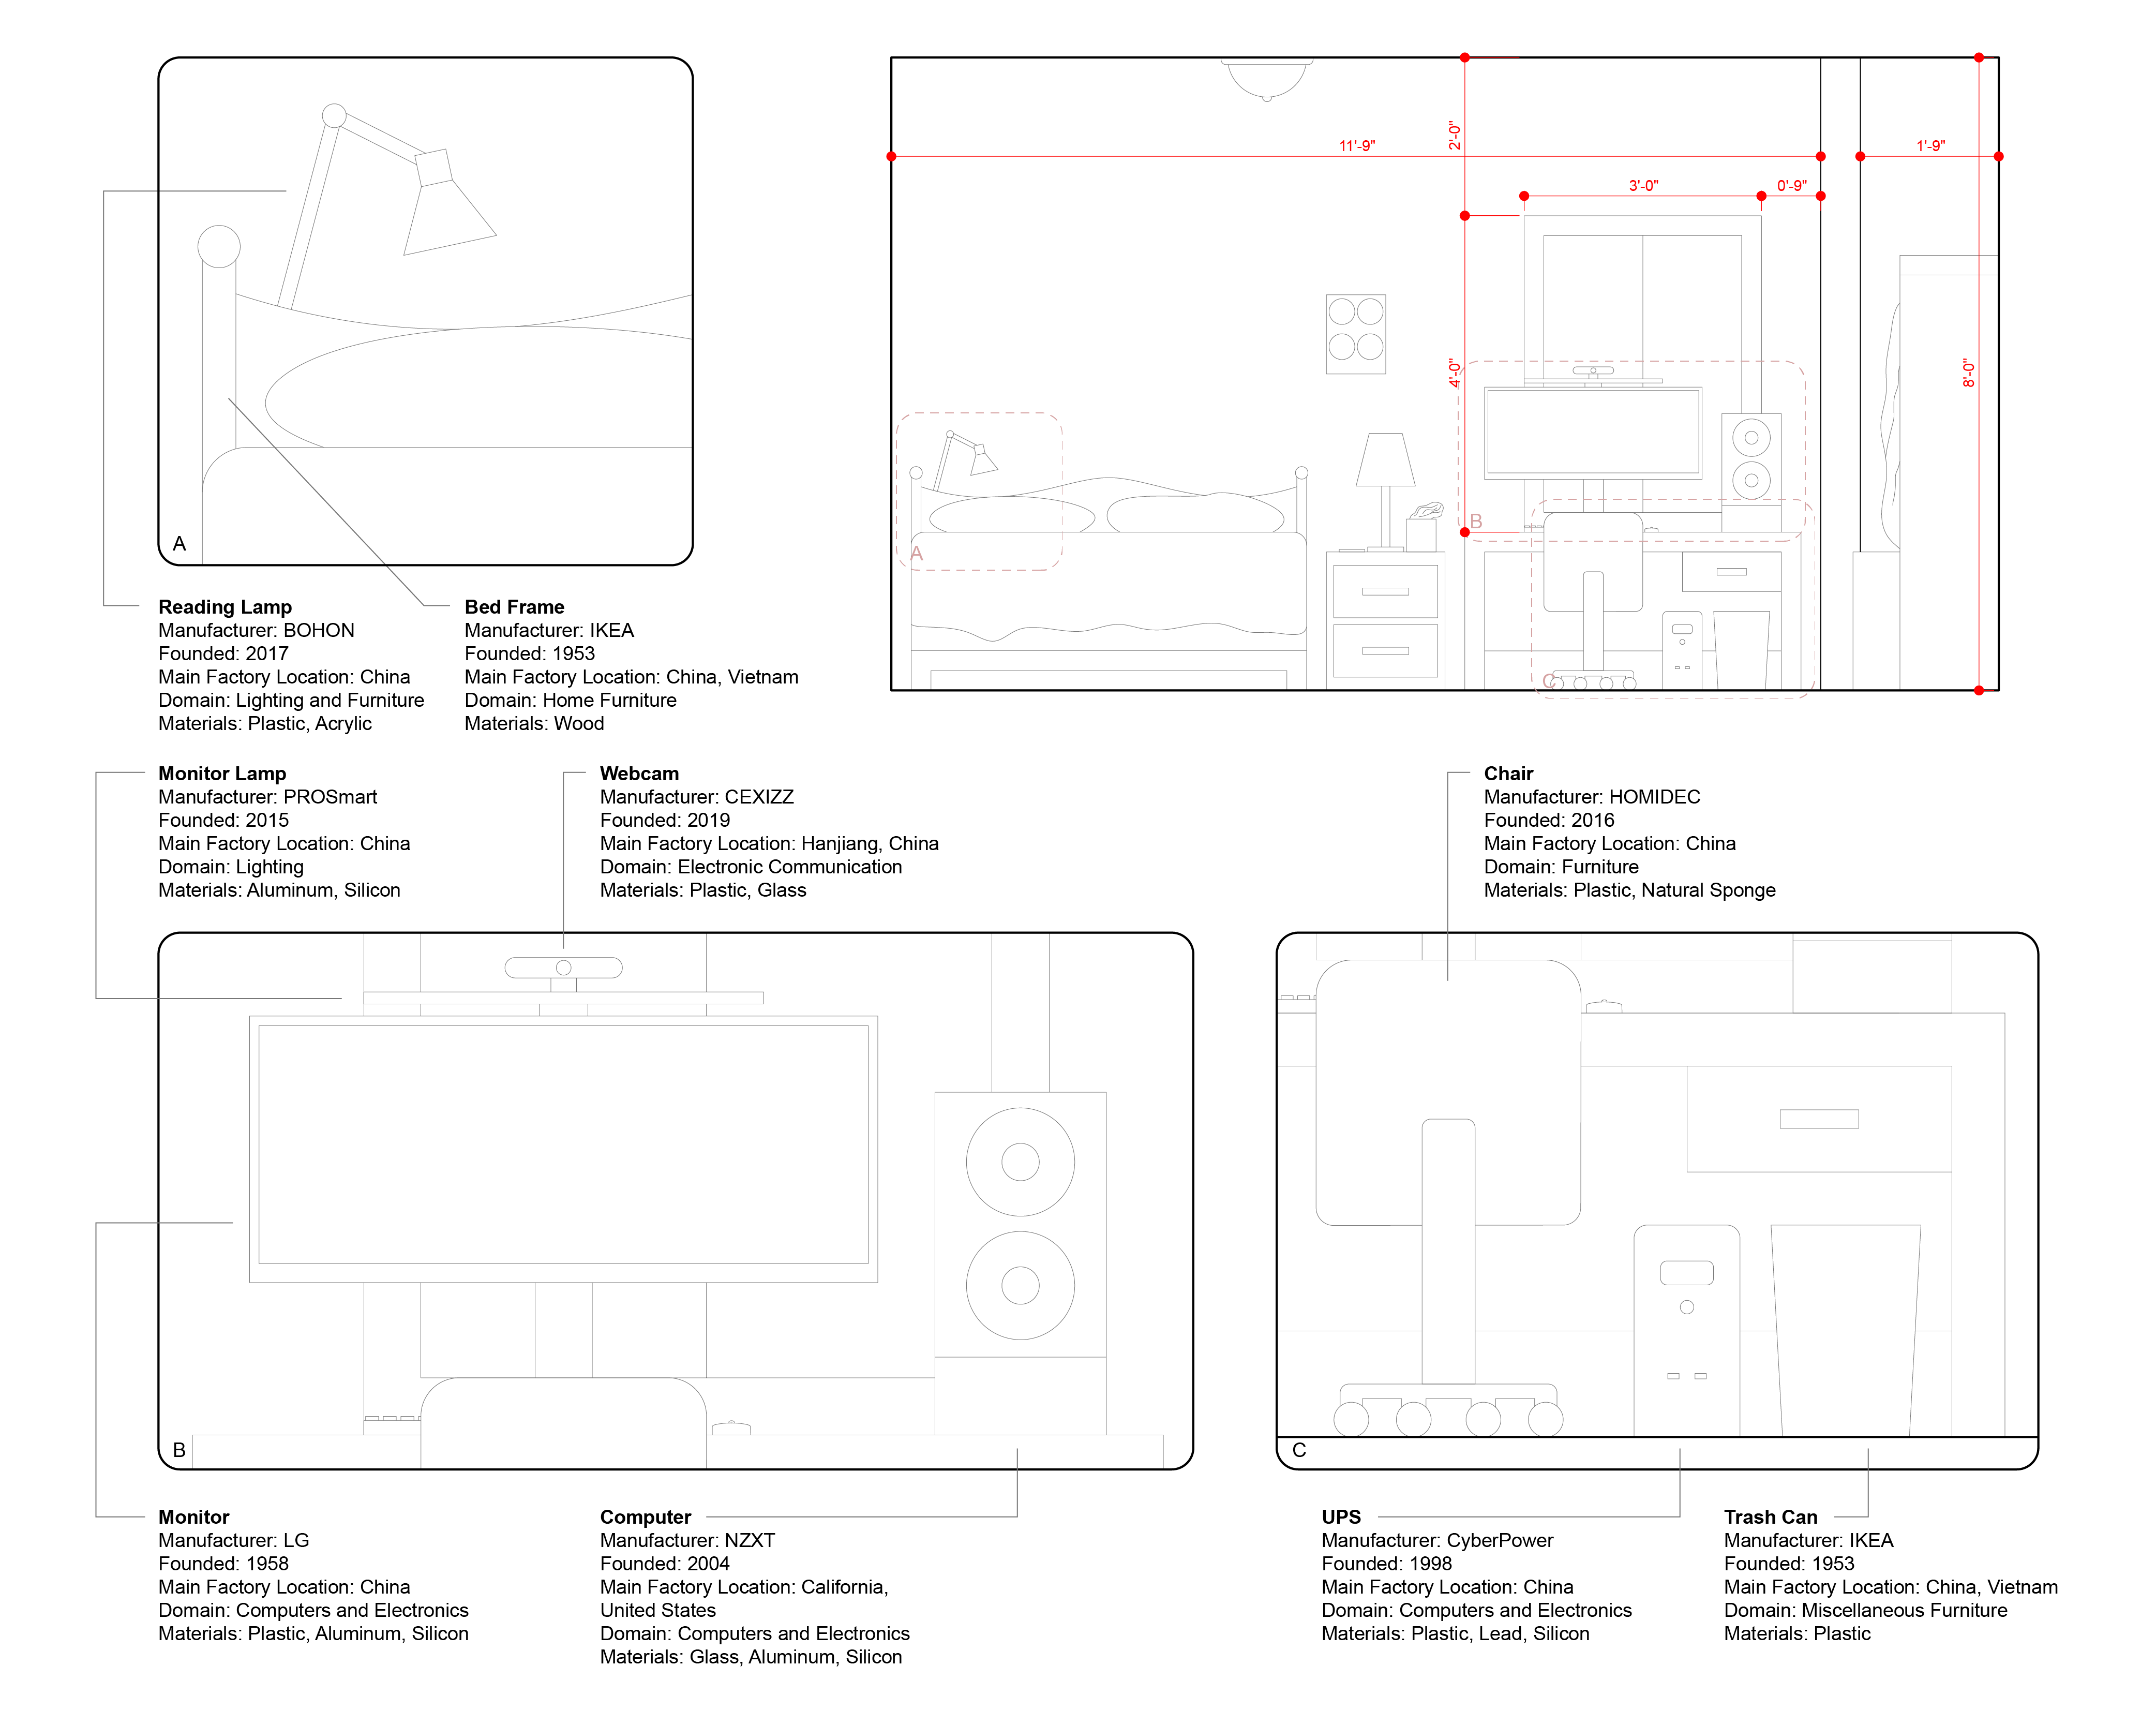
Along this southernmost wall lies the components that help support the majority of my daily activities. Along the left side is my queen bed (26" tall) and my nightstand. This space occupies the essentials for rest and sleep whereas the right side supplies the necessities for my daily tasks. The desk supports my desktop computer (NZXT) and monitor (LG). It is situated in front of my 3'x4' window that provides daylight into this otherwise dark room.
My Actor-Network Map focuses around the technology in my room, namely my desktop computer made by NZXT. I constructed my map from the mere concept of how the computer came to be in my possession. From there, I expanded on each process and along the way made discoveries around
manufacturing
and development that have affects on more than just the computer alone. As NZXT computers have combine their own manufacturing of PC cases and coolers that are produced in China, they also source other components from third-party manufacturers. Each of these has effects on disciplines ranging from treatment of workers in Chinese factories, the environmental and health effects that come with the mining of silicon, and even how the recent chip shortage has affected many seemingly unrelated industries. This is something that can be extended and applied to all tech, not just my desktop computer.
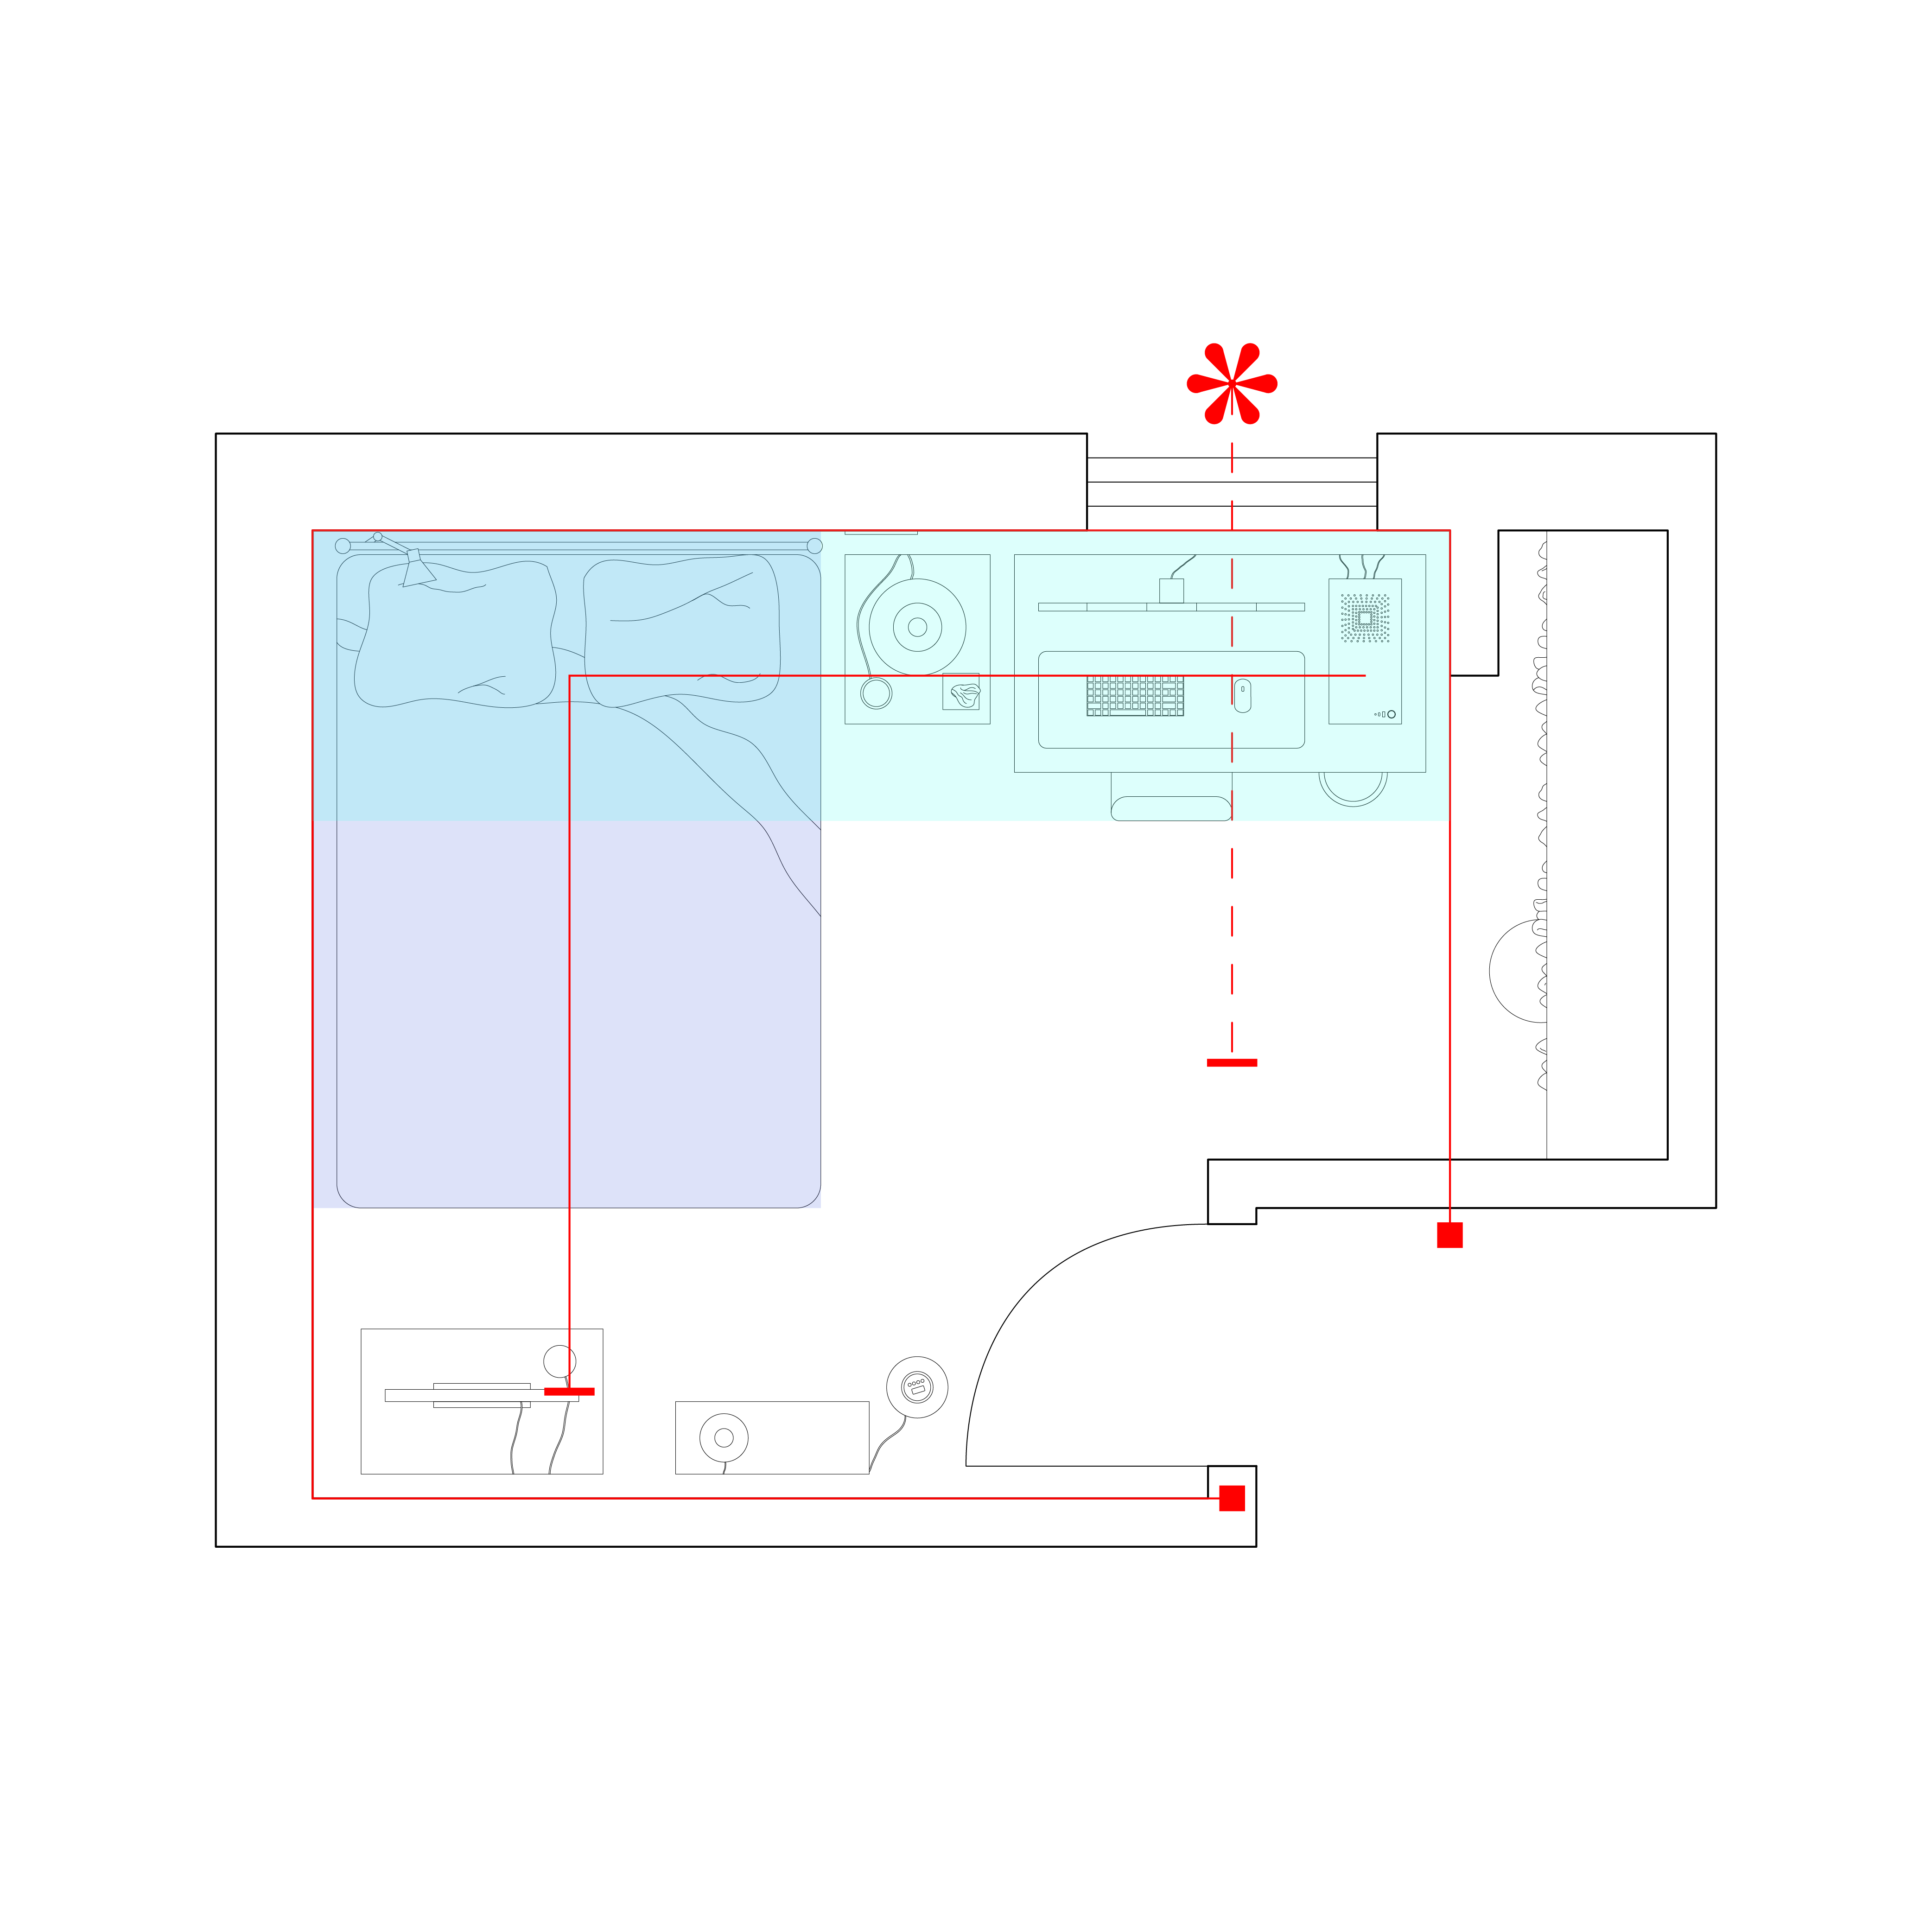
This organizational diagram of my bedroom highlights zones of activity, lighting conditions, and overall geometry/density of the space. The room is bounded by a rectilinear shape that is open along the northwest quadrant. The limited circulation path is more or less bounded by the resulting furniture that lies along the perimeter of this boundary. The density of furniture along the southern wall are highlighted and designate a zone of high utility and daily activity. This is adjacent to the area of rest and entertainment. It is connected by a path line recognizing this continuous zone of activity and movement. A single straight line draws the only source of exterior lighting into the enclosed space.
The five lines that make up this graphic composition directly mirror that of the organization diagram. A large, bold dashed line bound the space together and contain all other components within it. Two large squares on both ends emphasize this single moment of entry. The resting area is contained by a thick and patterned dashed line to represent a clear space of separation and isolation from the working area. To illustrate this idea of density and work, a tightly arranged grid marks the southern wall as a source of high utilization. This is intersected by a large dotted pattern to illustrate the path of light entering the space. This is all tied together by a dashed direction line of density and activity starting from an area of work and terminating in an area of rest and entertainment.

The resulting vectors produced by my graphic composition were extruded to various heights loosely corresponding to their level of activity. The tightly packed grid symbolizing levels of high working activity were thus extruded and rotated tallest. The boundary line was broken up and rotated at various points along the path to create a sense of boundary not just in plan, but in elevation too. The dashed lines designated for identifying the area of rest were deliberately left at a lowered elevation to align with the idea of lower activity. The connecting line between the work and rest area also creates this balancing connection with some of its lines being rotated to invoke a sense of balance and directionality.
Sheets of the dashed boundary line both enclose the activity within and expose it at the same time. This section animation of the site plan best illustrates the levels of activity as the heights try to correspond to the activity level. It is clear that the level of density moves as it cuts down - shifting from the working desk area with incoming daylight on the far end to a more relaxed and darkened sleep and entertainment area.

This view looks in from the moment of entry and demonstrates the movement of density throughout the space. It becomes clear that all levels of activity are derived from the enclosing boundary. As the section cuts further back, the levels of activity are revealed and can help separate these different forms of utilization. In particular the work and rest areas become independently defined and show clearly separate use cases, however are still connected by sheer density of the graphic elements.